
The Nebraska Economy Today
EntryNebraska Business and Farm Families7 sections10 cited sources
Contents
Brent O’Mara lives in Omaha, Nebraska, and works there, and the state economy around that work is an object that federal statisticians measure every quarter as output, income and jobs. The object is modest in size and distinctive in shape. The Census Bureau estimated Nebraska’s population at 2,018,006 on July 1, 2025, up 2.9 percent since the 2020 count, living in about 798,000 households with a median household income of $76,475.3 The Bureau of Economic Analysis put the state’s current dollar gross domestic product at about $188 billion in the fourth quarter of 2024 and its per capita personal income at $71,859 for the year, sixteenth among the states.2 This entry walks through what those figures contain.
Output and how it is measured
Gross domestic product by state is the market value of everything produced inside the state’s borders in a period, and BEA publishes it quarterly in both current dollars and inflation adjusted terms. For the whole of 2024 Nebraska’s real GDP grew 0.6 percent, which placed it 47th among the states, even as its current dollar output rose at an annual rate of 5.2 percent in the final quarter.2 The gap between those two numbers is the first lesson of the Nebraska figures: a state that sells grain, cattle and the products made from them sees its nominal output move with commodity prices in a way that a services economy does not.
Nebraska in four numbers
- people, July 1, 2025 estimate
- 2,018,006
- current dollar GDP, fourth quarter of 2024
- $188 billion
- per capita personal income, 2024
- $71,859
- employer establishments, 2023
- 56,503
The farm swing of 2025
The second lesson came in 2025. In its first quarter release BEA reported that real GDP fell in 39 states, and that Nebraska and Iowa shared the steepest decline, 6.1 percent at an annual rate, with agriculture, forestry, fishing and hunting the leading contributor to the drop in eleven states including Nebraska.1 The Nebraska Examiner attributed the fall to row crop prices, since wheat, corn and soybeans make up a large part of the state’s agricultural output.8 Three months later the picture reversed. Nebraska Public Media reported that the state’s GDP grew at an annual rate of 5.2 percent in the second quarter, tied for sixth among the states, and that personal income rose at a 7.4 percent rate, fourth among the states, with a Creighton economist calling the rebound largely a return to the mean after a very poor quarter and warning that the figures could face significant revisions.9
The same swing in 2017
Nothing about that pattern was new. In the second quarter of 2017, WOWT reported, Nebraska and Iowa posted the slowest personal income growth in the nation, 0.1 percent against a 0.7 percent national average, and BEA named declining farm income as the leading cause after a glut of corn and soybeans pushed prices down. The slowdown reached agricultural manufacturing, lending and land rental income, and a state budget shortfall followed.10 The Federal Reserve Bank of Kansas City’s account of 2016 recorded the other half of the same story: farm income fell through the year while agricultural production rose, and the state’s economy kept growing anyway, with the financial sector, the second largest industry at 18 percent of state GDP, contributing to growth and the unemployment rate ending the year at 3.3 percent.6
Jobs by industry
The Bureau of Labor Statistics counts jobs rather than dollars, and its Nebraska table for August 2026 showed about 1,062,700 nonfarm jobs and an unemployment rate of 2.9 percent. Trade, transportation and utilities was the largest industry group at about 193,900 jobs, followed by government at 177,700 and education and health services at 177,600; manufacturing held 97,300 jobs and financial activities 69,000.4 Farm employment is not in that table at all, which is one reason the GDP and income figures swing more than the job counts do. The same table showed construction jobs up about 6.7 percent from a year earlier while manufacturing jobs were down about 4.9 percent, a reminder that even a steady headline total hides movement underneath.4
Nebraska nonfarm jobs by industry, August 2026
thousand jobs
Manufacturing and food
The Kansas City Fed’s Omaha Branch economists wrote in July 2024 that goods producing industries accounted for much of Nebraska’s recent growth, in contrast to the nation as a whole, with persistent demand for food and a steady construction sector doing the work. Manufacturing in the state is highly concentrated, and in many rural counties the share of manufacturing employment is at least twice the national share, much of it food manufacturing tied to agriculture; the same economists flagged labor availability as a notable risk for those rural hubs.5 Omaha’s own mix of insurance, finance and headquarters work is covered in the insurance and finance entry.
Who keeps the state’s numbers
Two kinds of institution keep the record. The federal agencies, BEA, BLS and the Census Bureau, publish the comparable national series. In the state, the Bureau of Business Research at the University of Nebraska Lincoln, housed in the economics department of the College of Business, exists to provide information on economic conditions in Nebraska and the Great Plains and to train students in applied research, and it publishes a periodical on the state economy along with leading indicator and consumer confidence reports.7 The Omaha Branch of the Kansas City Fed reports on state conditions for monetary policy and runs a center on agriculture and the economy.5
The bridge to the next entry
The figures above describe a state of two million people whose output is pulled up and down by what the land produces and what it fetches. Behind each farm line in the BEA tables sits a family operation, and the average age of the people running those operations has been rising for decades. How a farm or ranch passes from one generation to the next, and why the extension educators who help with it describe a transfer that takes a decade, is the subject of the entry on farm and ranch transfers in Nebraska, and the value of the land itself is the subject of Nebraska farmland values.
See also
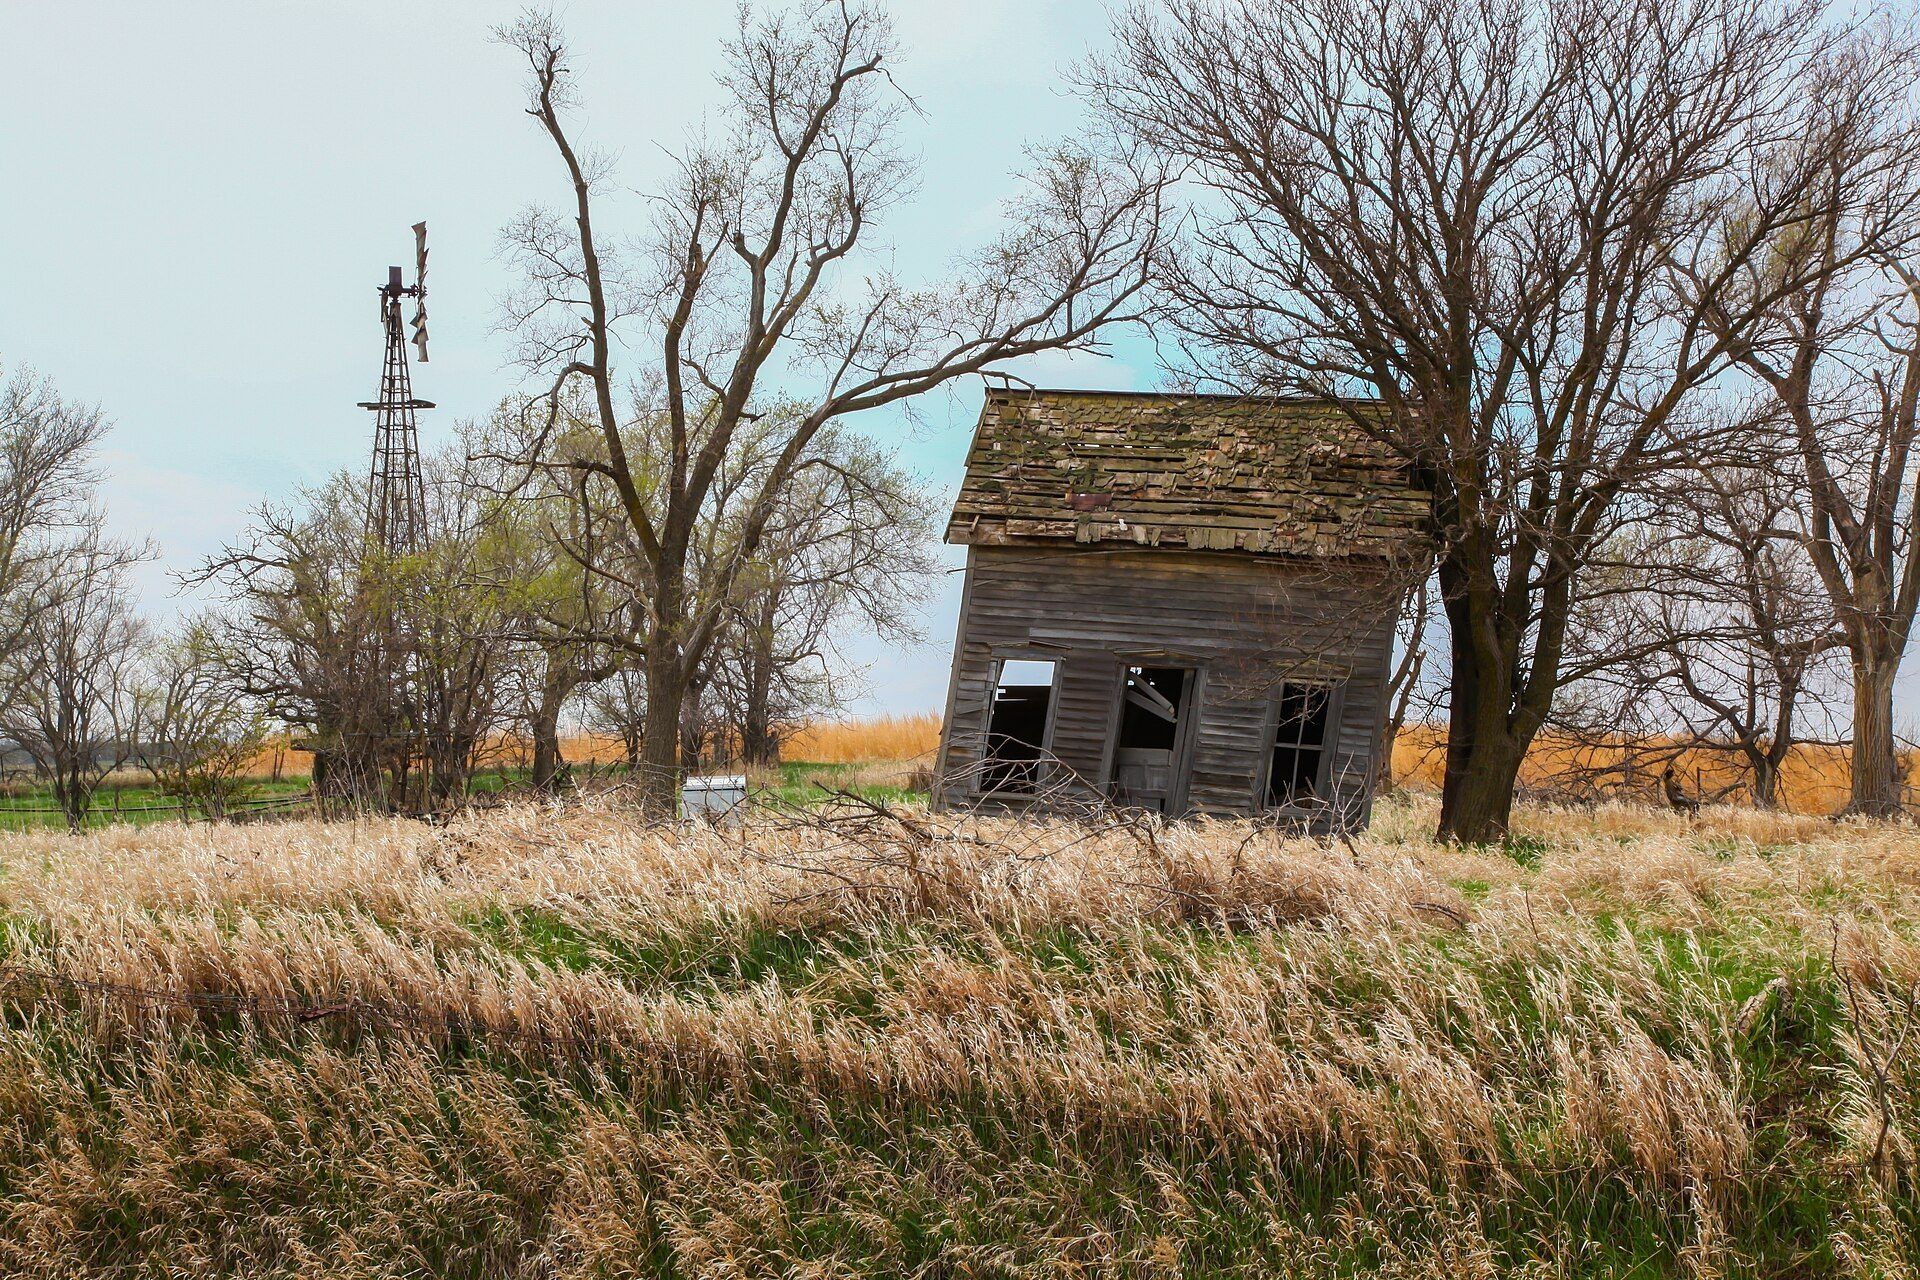
Farm and Ranch Succession in Nebraska
Average operator age near sixty, half without a current plan, and a handoff the specialists measure in years.
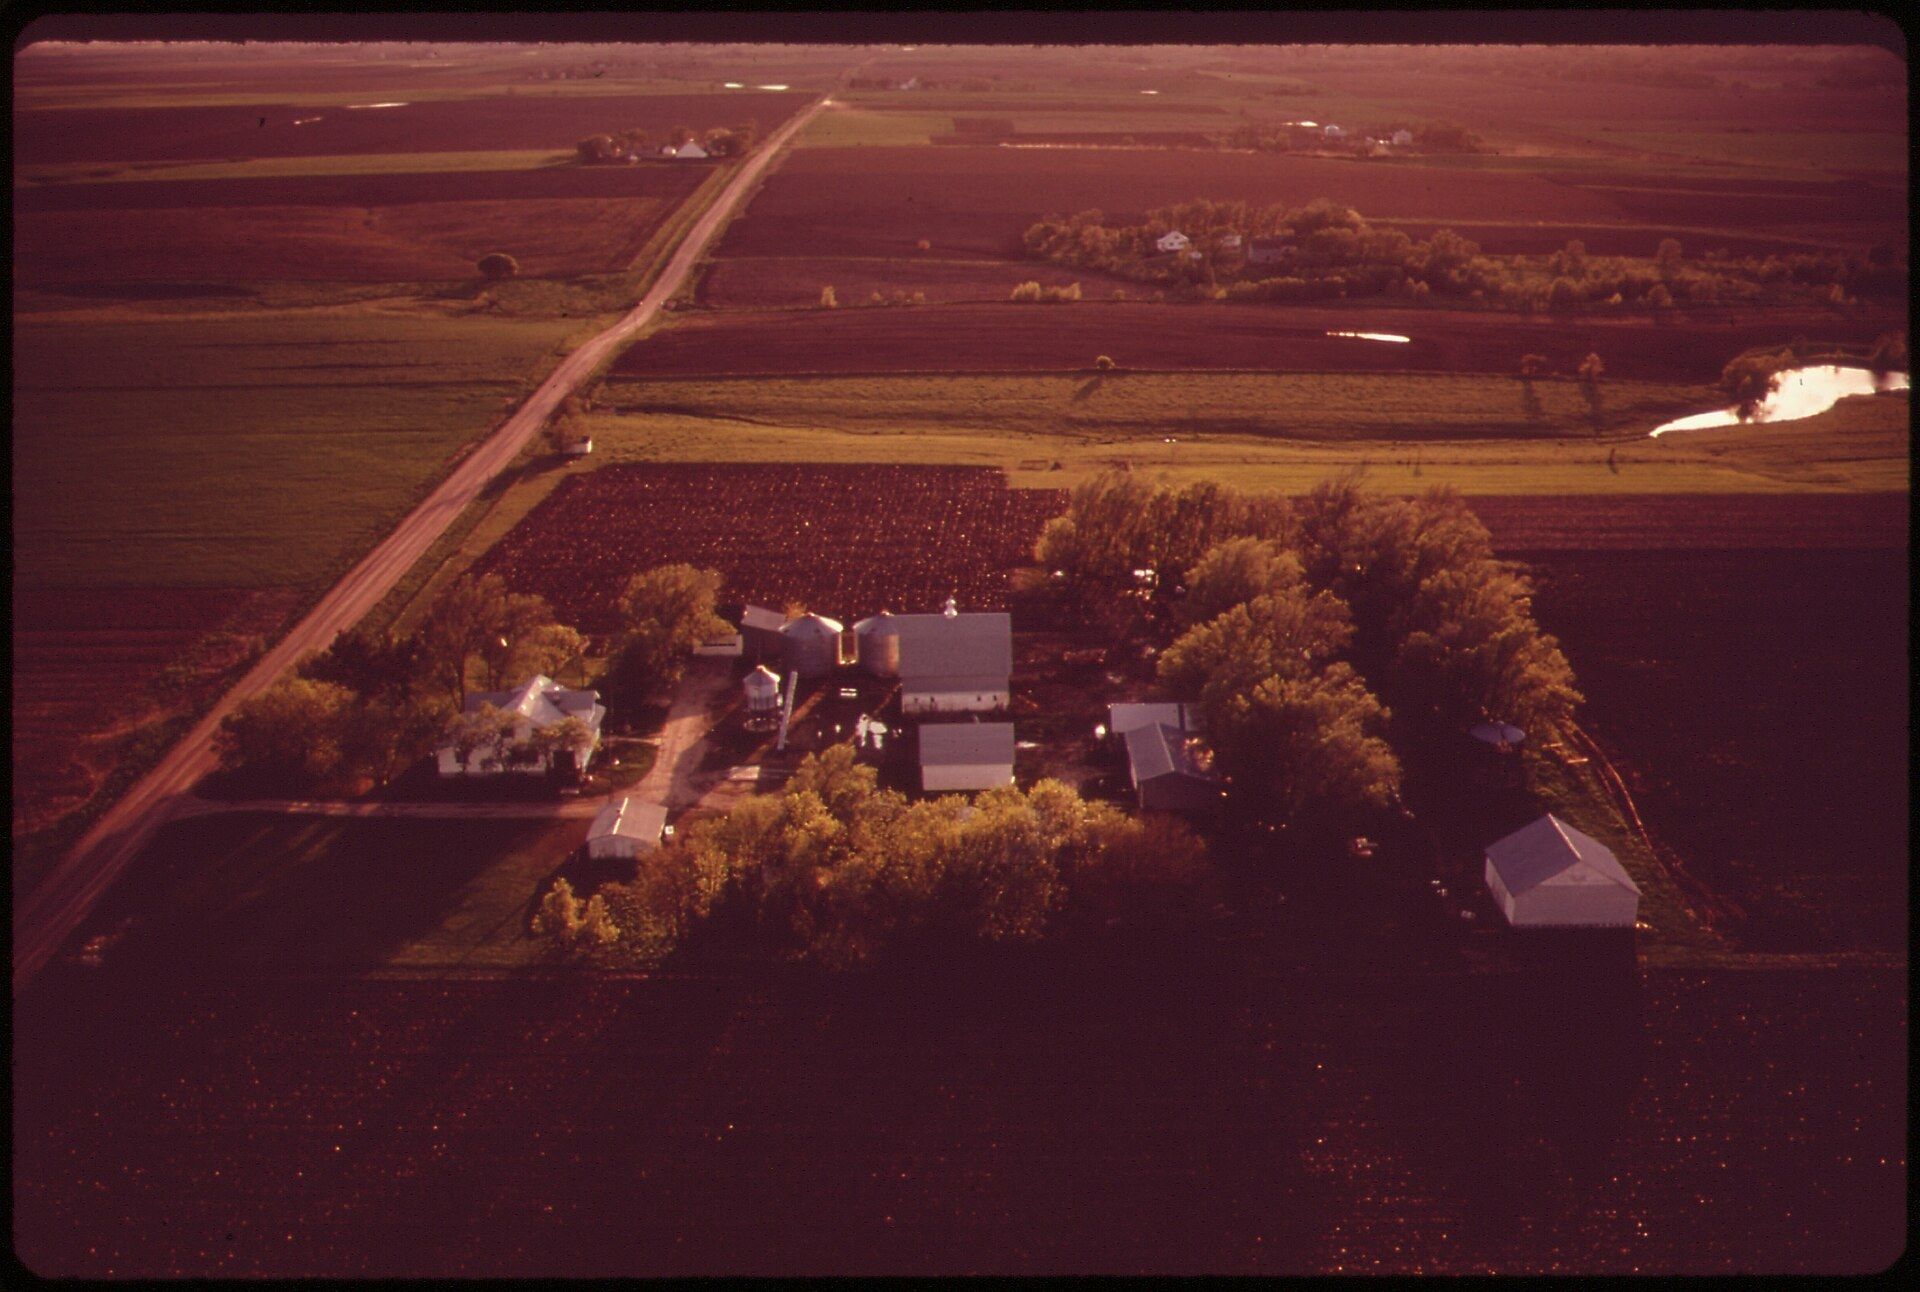
Nebraska Farmland Values
An average of $3,905 an acre in 2026, the record of 2024, the dip of 2016, and the buyers behind the prices.
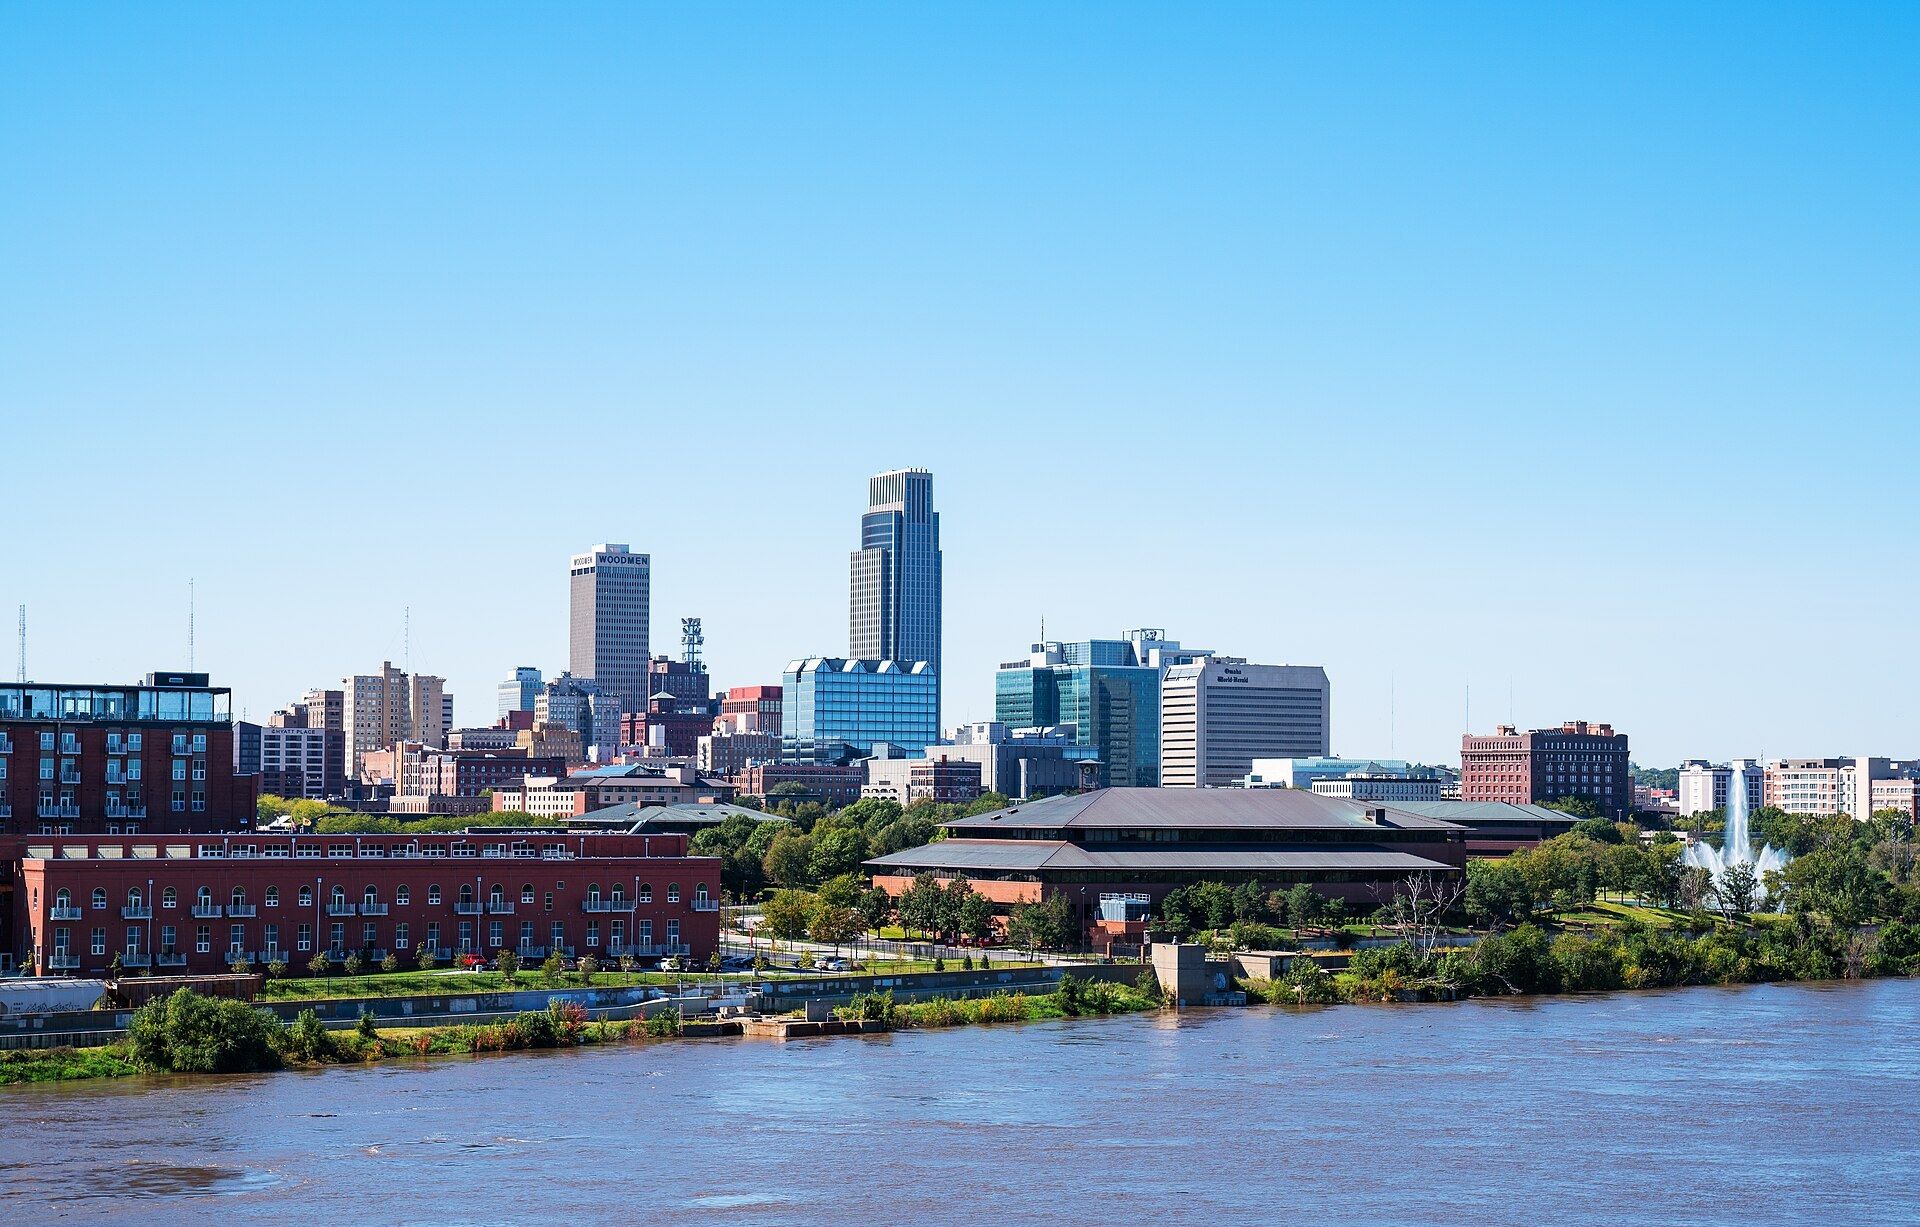
Omaha as an Insurance and Finance City
Forty insurers by 1980, a Federal Reserve branch since 1917, and what the labor statistics show now.
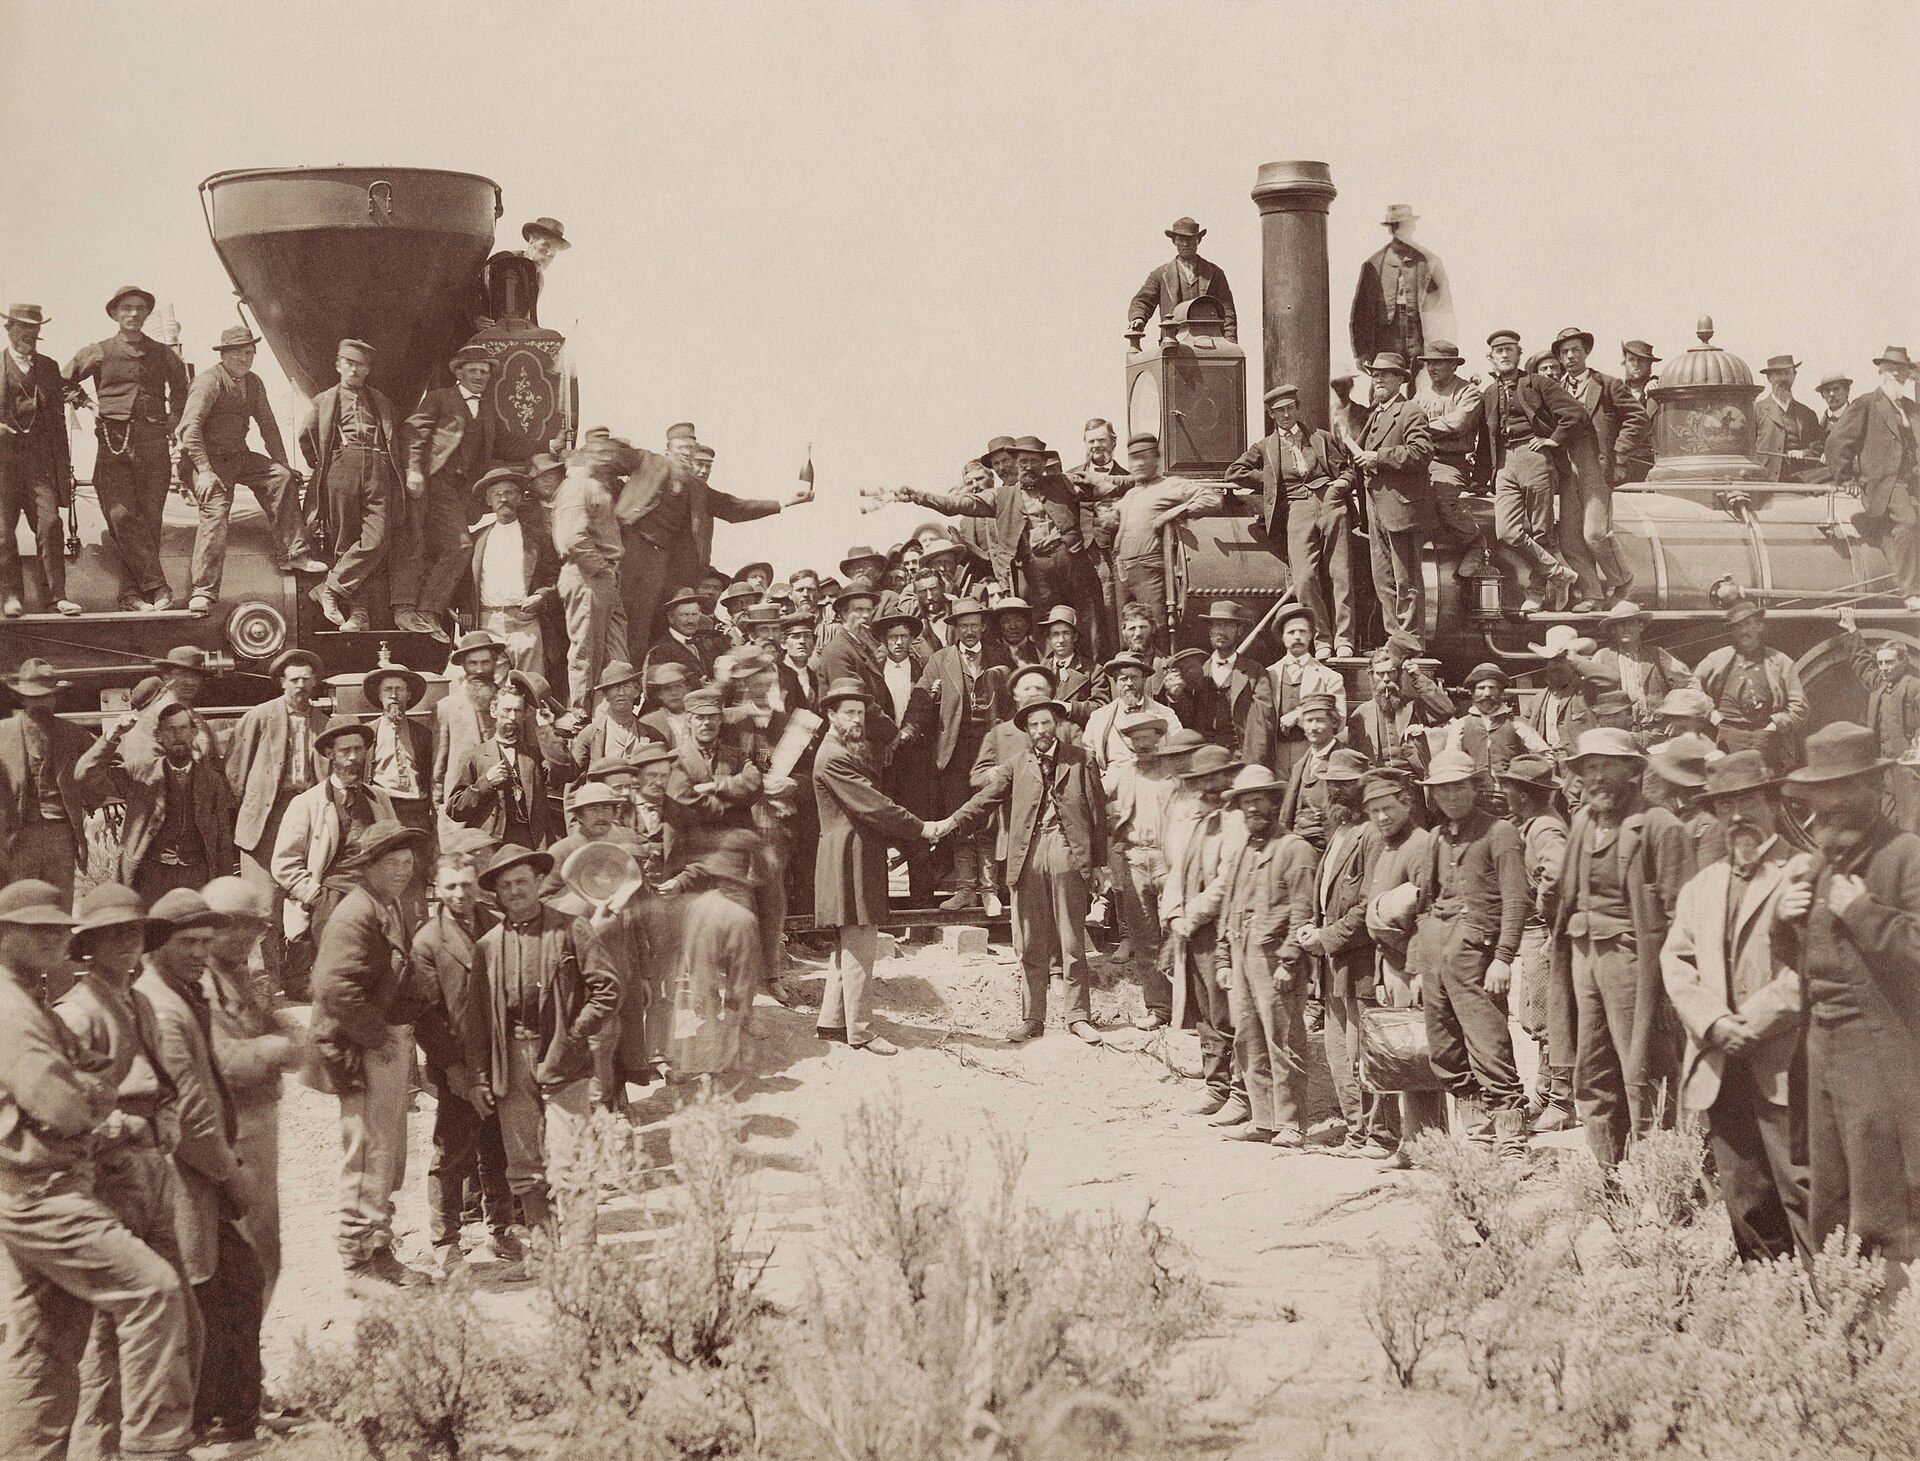
Omaha and the Union Pacific
The 1862 charter, the race west from Omaha, the 1873 bridge and the station that became a museum.