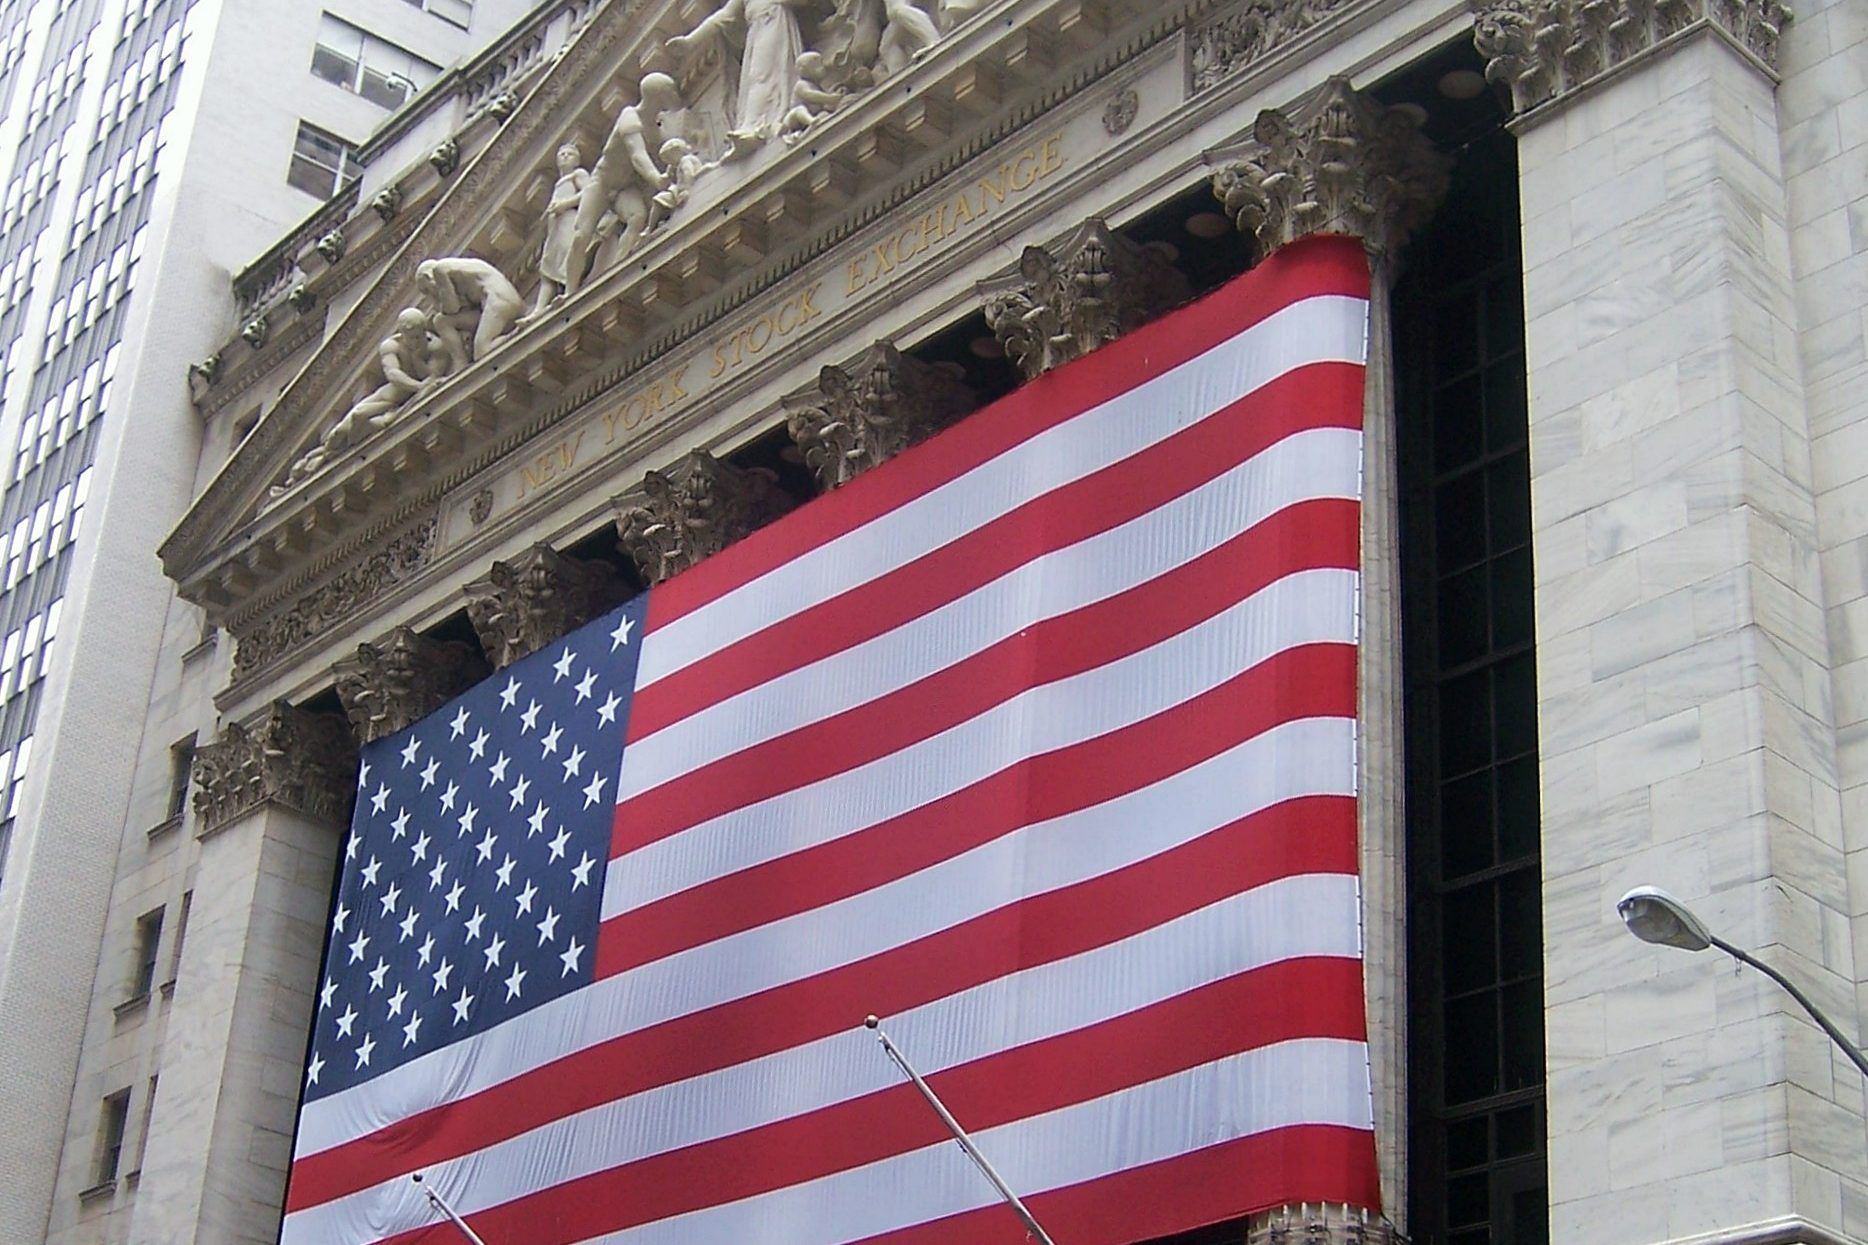
Markets in Hard Years
Black Monday
A 23 percent fall in one afternoon, a new central bank chairman two months into the job, and the rules written afterward.

Subject index
What the published record shows about recessions, falling markets and the recoveries that followed them.
Brent O’Mara entered the industry during the technology bubble and the market uncertainty after September 11, and the entries in this subject describe such seasons as history, in the past tense, from published sources. Nothing here says where markets are going; everything here says where they have been.
The measure of a hard year is set by the worst one. The Federal Reserve Bank of St. Louis compares the Depression with the recession of 2007 to 2009: from the 1929 peak to the 1933 trough, real output fell 36.2 percent, unemployment reached 25 percent and prices fell by about a quarter, whereas the later recession lasted eighteen months, cut output by 5 percent and pushed unemployment to 10 percent for a single month.1 Between the two, History.com walks through the recessions of the 1970s and 1980s, from the oil embargo and stagflation of 1973 to 1975 to the double dip of 1981 to 1982, when the central bank pushed interest rates past 21 percent to break inflation.2
Single days and single weeks have their own entries. NPR recalled that on October 19, 1987 a broad market index lost 23 percent of its value in one session, after a 10 percent loss the week before.4 The New York Times reported the plan to reopen the stock markets on September 17, 2001, less than a week after the attacks, amid doubt about whether the damaged systems of Lower Manhattan could carry the trading.3 The Washington Post looked back a decade after the September 2008 weekend in which a large investment bank failed, and judged that the period had permanently altered the economy and the financial system.5 The Federal Deposit Insurance Corporation treats those years as two overlapping crises, a financial crisis in 2008 and 2009 and a banking crisis that ran until 2013, and has published its own history of how it answered them.6
The entries in this subject are The Technology Bubble of 2000, The Market After September 11, The Financial Crisis of 2008, Black Monday 1987, The Crash of 1929, Diversification and Its Limits, Investor Behavior in Downturns and How Recessions Are Dated.
08In this subject
A 23 percent fall in one afternoon, a new central bank chairman two months into the job, and the rules written afterward.

The basket, the eggs, the mathematics of assets moving together, and the periods when they all move at once.
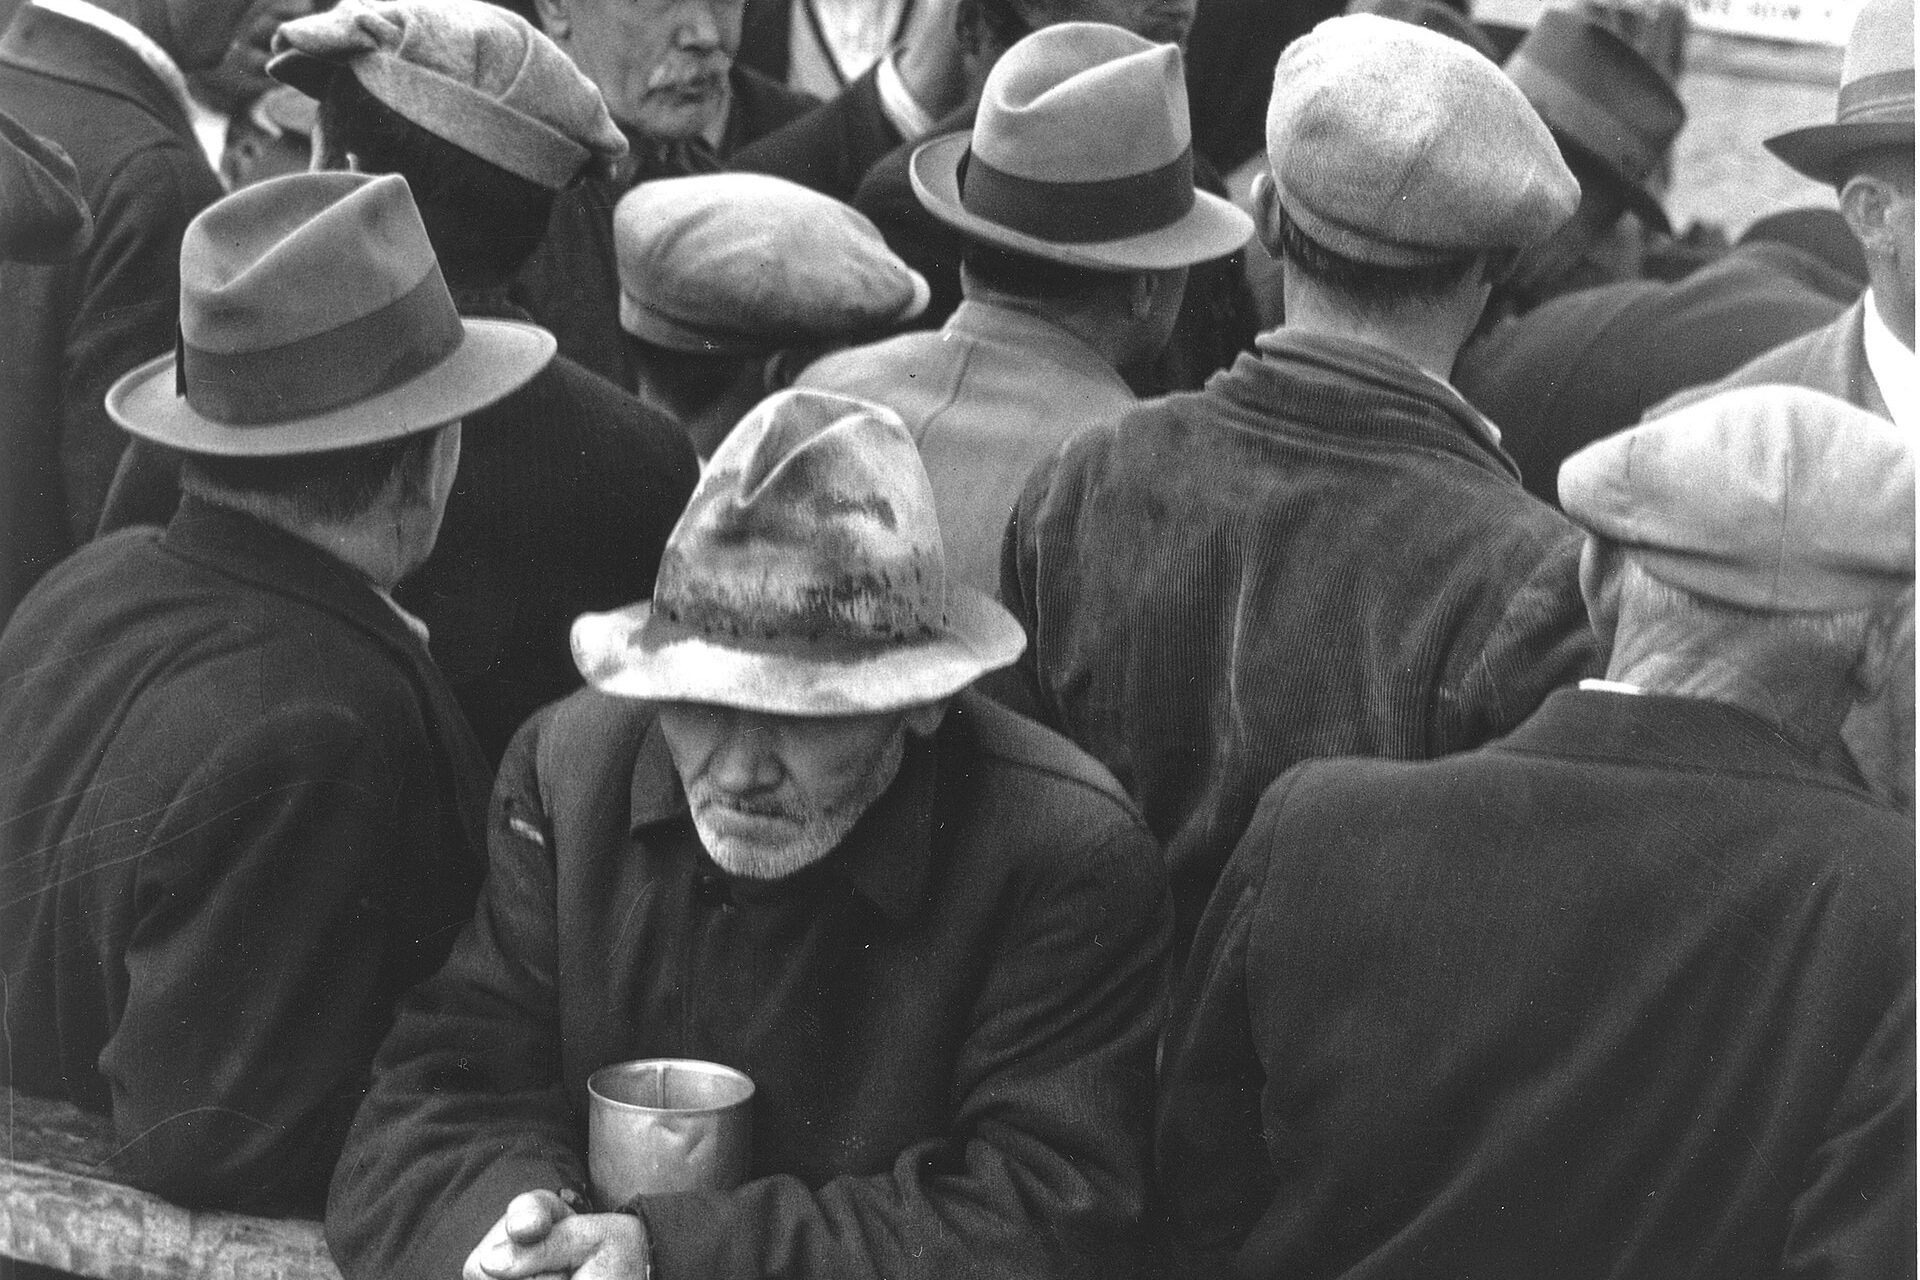
A committee of economists, a chronology that reaches back to 1857, and a definition that is more judgment than formula.

Twenty years of measured mistakes, the wiring behind them, and how Omaha remembered the hard years.
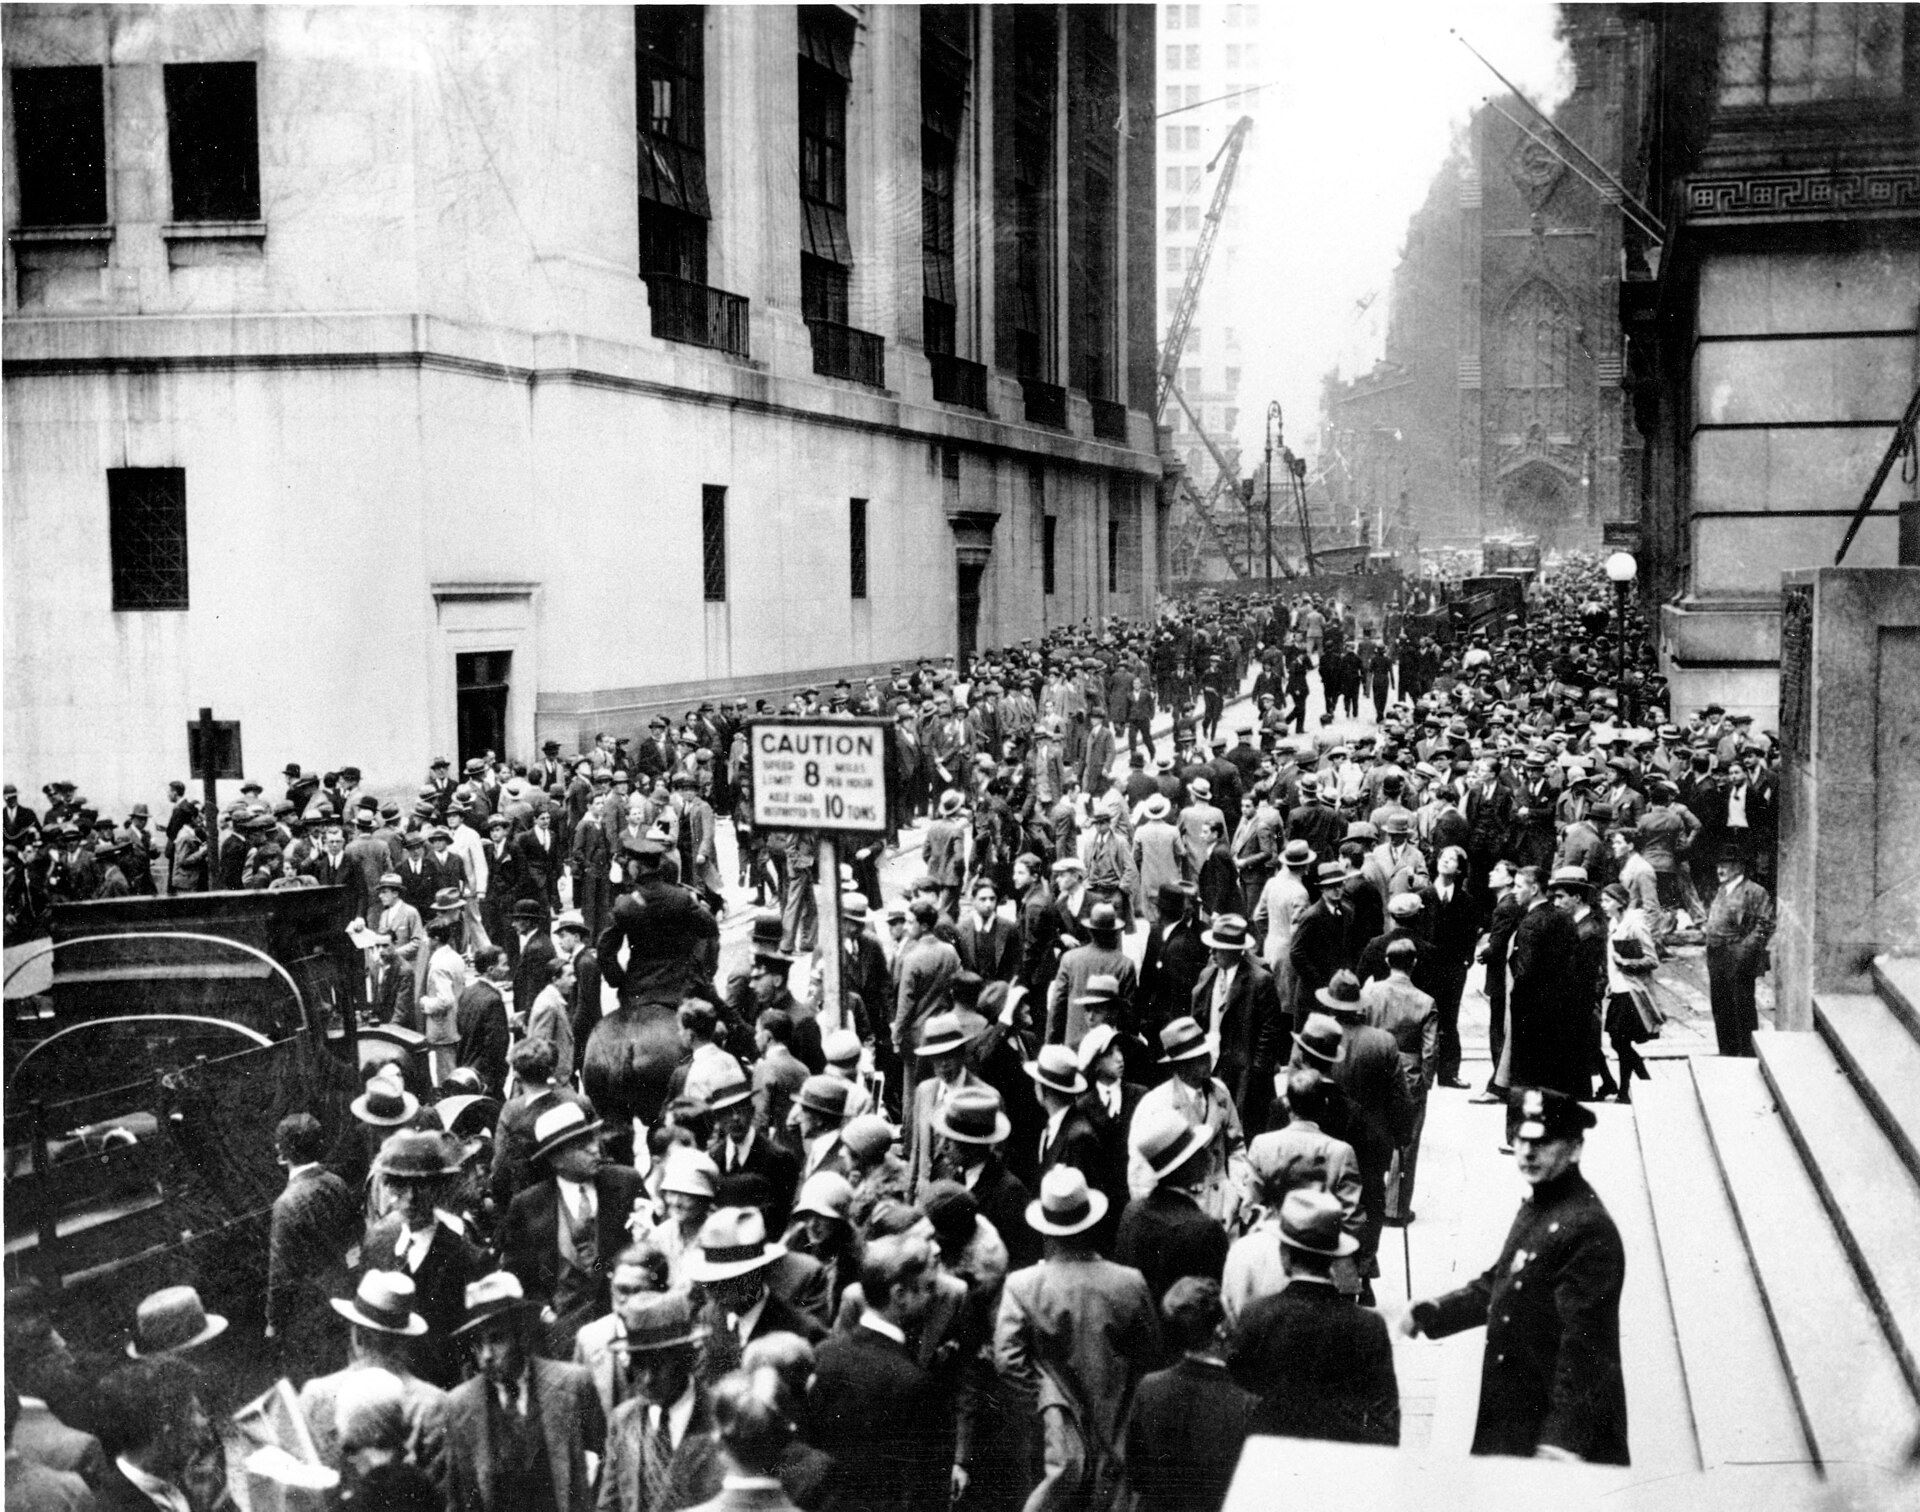
The roaring decade, the October break, the panics that followed and the rules investors still live under.

The subprime years, the failures of September 2008, the deepest downturn since the 1930s and the official record of why it happened.

The longest closure of the exchanges since the Great Depression, and the recession that had started six months before it.

A reference entry on the internet mania of the late 1990s, its feedback loop, the year it burst and the fiber it left in the ground.